Search Results
288 results found with an empty search
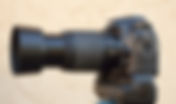
- Micro Nikkor 60mm AF-D Review
This review is primarily concerned with resolution. The Nikkor 60mm f/2.8 AF-D seems to have a mixed quality reputation among users. My copy of this lens is really, really good in the center. Corners aren’t so hot until f/5.6. This is an older lens (1993-2008), but it’s built to very good mechanical standards. Note that you will need an upper-end camera body that has a built-in focus motor to use this lens. It’s an “FX” lens, so it will work on full-frame models. I have read lots of reviews where they complained about its short focal length, but on a DX camera I have rarely had any issues with a too-short lens-to-subject distance. This includes many butterfly shots; lighting isn’t a problem, nor do I have much of an issue with scaring bugs away. I generally use an SB-600 flash and “FP” mode outdoors for close-ups with high shutter speeds. I have a separate article on “FP” mode if you’re interested. Please, please don’t use the camera built-in flash. If not for you, do it for sake of art. I have always liked this lens for portraits, too. On DX, the focal length is quite nice. The 2.8 aperture might be considered a limitation for portraits; it’s a matter of your own taste. I’m not saying it’s going to replace my 85mm, but before I got my 85, the 60 was the go-to lens for portraits. Autofocus isn’t perhaps blazingly fast, but it’s not a problem. Maybe it’s just me, but I still like having autofocus available when I’m shooting close-up and hand-holding the camera. Judging sharpness with manual focus just isn’t for me. There’s a “focus limit” switch for quicker focusing at non-macro distances. If you’d rather do manual focus, then press the little chrome "unlock" button on the lens barrel and then rotate the "M - A" ring to “M”. Most people obviously use macro lenses for close-up photography, and I’m no different. I almost always use a flash, and I stop the lens down for depth of field. A bonus with stopping the lens down is resolution; you’ll see below how dramatically the resolution across the frame improves at smaller apertures. Resolution peaks at f/8.0, and then diffraction rears its ugly head after that. The lens focuses down to 1:1 magnification. If you like to standardize on this level of magnification, you may want to consider other lens options that aren’t going to be as challenging for lighting and lens-to-subject distance. It’s only about a 3-inch gap from the front of the lens to your subject at 1:1 magnification! If you want to go through the pain of evaluating your own stuff, then you need to get the MTF Mapper program and print out the resolution target files at that site. The software (as of this writing) is free, and the author Frans van den Bergh is to be commended. The download site is here http://sourceforge.net/projects/mtfmapper/ I discuss using his program in another article. The article is a ‘Cliffs Notes’ version with enough detail to get you started, but without the finer points being included. You really should give Frans’ stuff a read, however, if you want to understand the technology it contains. MTF50 Measurements I measure lens resolution at MTF50. Most published manufacturer MTF charts are at MTF10 (contrast) and MTF30 (resolution). Except for maybe Zeiss and Leica, those MTF charts are “theoretical”, meaning they don’t have much basis in reality. And they don’t ever show the whole frame, which is the only decent way to evaluate resolution. The "MTF" refers to Modulation Transfer Function, which refers to how light/dark transitions happen. "MTF50" refers to the highest line frequency (line pairs per millimeter) you can have before 50% of the contrast is lost. Values above about 30 lp/mm are considered pretty good, and anything above 50 lp/mm is outstanding. I made the tests with a Nikon D7100 (APS-C sensor, 24MP). Bear two things in mind; corners for FX will be worse and other camera resolutions will get different MTF50 values. For instance, the D7000 gets up to 24% less resolution (I tested it). Lesser lenses will show a smaller improvement with higher-resolution sensors, because the lenses aren’t as capable. What the resolution chart looks like The picture above shows what gets photographed (unsharpened, RAW) and evaluated. The program author, Frans, has a couple of chart designs, but the main idea is to align the little squares to get their edges in sagittal (spoke) or meridional (tangent) directions. The squares need a little ‘slant’ to them (5 degrees is optimal) to get measured optimally, similar to what Imatest does. Measurement algorithm problems arise if the little square orientations approach vertical or 26.565 degrees. If you try testing yourself, don’t get too sloppy about orienting the chart, and bear in mind that the squares must always be bigger than 25 pixels on an edge. The chart squares emanating from the center along 45 degrees (“X”) have MTF readings that can be 2 or 3 percent higher than they deserve. This is the tradeoff between the desire to get sagittal/meridional measurements and approaching the critical ‘bad’ slant angles. The Imatest guys have punted on this and don’t align their target squares in sagittal/meridional directions; they have 5-degree slants on all of the squares. You’ll see an “X” pattern on some of the 2D resolution plots below, due to this effect. Resolution Tests MTF50 60mm f/2.8 wide open This is really good performance for being wide open, in my opinion, but NOT in the corners or edges. Note that the EXIF data got messed up for “focus distance”. The tests were done with an “A0” chart size. I don’t have a really good small-sized resolution chart, so tests were done at more conventional distances. Limited testing I tried at closer distances didn’t show resolution improvement, although urban legend says macro lenses improve resolution as you get closer. 60mm f/4.0 MTF50 Notice you get an immediate 40% jump in resolution going from f/2.8 to f/4.0 (just a one-stop difference) in the corners. Again, this is only one copy of the lens being tested; no guarantees on how yours might perform. Only a 9% resolution increase in the center, but resolution was already stellar at f/2.8. 60mm f/5.6 MTF50 I’m getting another 29% resolution jump going from f/4.0 to f/5.6 in the corners, but I didn’t see center improvement; it’s already so good that I can’t complain. 60mm f/8.0 MTF50 This brings tears to my eyes. I’m so proud of this lens! Peak performance everywhere in the frame. This is the aperture to even start to have sufficient depth of field for most close-ups. 60mm f/11.0 MTF50 Diffraction starts at f/11. Still great resolution, so don’t feel you need to avoid this aperture. Beyond f/11, resolution suffers quite a bit. The lens goes to f/32 (f/57 at 1:1 magnification!) for those subjects where depth of field needs to trump resolution. Conclusion I have compared this lens to the 105mm f/2.8 AF-S VR Micro Nikkor, and it is actually sharper in the center than the 105 (by 13%). The 105 smokes it in the corners until f/5.6, though. Again, this is only looking at a single copy of each lens. Both are fine lenses, but the 105mm costs way more. I love my 60mm; it’s a true classic and I have no intentions of giving it up. Now let’s talk about un-sharp corners at f/2.8. Depth of field approaches zero at that aperture when doing actual macro photography. I would virtually never use the lens that way, so corner performance at f/2.8 is a “don’t care” for me. It is only useful for seeing a bright image through the viewfinder and enabling the camera to focus faster. It should be one of the last considerations for buy/no buy decisions unless you’re into astrophotography. Samples Butterfly 60mm f/10, 1/320, ISO 100, SB600 Flash Butterfly 60mm f/7.1, 1/500, ISO 200, SB600 Flash FP mode Lizard Fight 60mm f/18 1/60 ISO 200 Flash Don’t fear stopping down! Sufficient depth of field far outweighs resolution to capture important subject matter. #review
- Use Your Phone For a Camera Remote
Nikon ML-L3 Infrared Remote Don’t have your Nikon ML-L3 IR remote handy? No problem. Did you know that there are programs that you can download for your smart phone and use its infrared capability to trigger your camera shutter? You can even get more capability than the ML-L3 has, such as timed triggering and sound options. You can also select other camera remote identities, such as Canon, Olympus, and Sony. I downloaded Camera Remote Control from Dev Null using Google Play, but there are other choices as well. How cool is that? When I use a tripod, I always trigger the shutter with an IR remote. I configure (via the camera "Shooting" menu) the "Remote control mode (ML-L3)" and set it to "Remote mirror-up". The first press of the remote (or on the phone app) will raise the mirror, and the second press will release the shutter. This way, you can wait for vibrations to die down before releasing the shutter. #howto
- Manual Exposure With External Flash
Did you know that when you set your Nikon camera to manual exposure mode that your flash is still on automatic exposure? Why should you care? This happy combination of manual camera exposure and auto flash exposure is a big deal to me. Your main subject can be well-exposed by the flash, while the ambient light in the background can be controlled by how you set the manual exposure. Nothing screams amateur like indoor flash shots with jet-black backgrounds. If, instead, you expose the background about 1 to 2 stops under (using the camera meter), then your main subject can be exposed properly by the flash while the background (which is out of range of the flash) is pleasingly de-emphasized. If you use “FP” mode on your external flash, then you can even use this technique outdoors at whatever shutter speed and aperture combination that suits the scene. The flash “FP” mode allows any shutter speed, while filling in those nasty shadows in someone’s face under their eyes and nose. Your subject, of course, needs to be within range of the flash. The camera internal flash cannot be set to FP mode. Canon calls it HSS (High Speed Sync). Lower-end cameras may not offer this feature. If you set “Auto FP” mode for your external flash, then it’s a set-and-forget scenario. Your flash will go into FP mode when you set a high shutter speed, or else stay in the usual high-power-short-flash-duration mode with lower shutter speeds. My cameras are always configured this way. FP mode uses a series of quick flash bursts while your shutter is open, so it’s like continuous light. The quick bursts overlap each other just enough to seem like the flash is on the whole time the shutter is open. Any motion-stopping capability only resides in the shutter speed you use and not the flash. Be aware that the overall light intensity is reduced, so your flash won’t have the usual range. Expect to lose about 2 stops of flash intensity. Here’s a good resource on flash here. In case you’re wondering, “FP” is short for “focal plane”, and it really has nothing to do with an electronic flash. It alludes to special old-time “FP” flash bulbs that had long-burning characteristics, so that they would burn the whole time your “focal plane” shutter was open. This mode emulates that same long-burning flash bulb. You might need a neutral density filter if you’re using a really wide aperture in the sun, but the flash fill light really makes your subject pop (it adds that sparkle to the eyes). Please use bounce flash or a flash diffuser indoors when you can, or you risk getting those nasty hard shadows you really don’t want to see. Even the old lens tissue over flash with rubber band can be really helpful if you can’t use bounce. Diffusing the light will rob even more flash power, however. I guess that’s why they sell those powerful pro flashes. Macro photography outdoors using flash FP mode and manual exposure is a marriage made in heaven. It’s the cat’s pajamas. It’s the bee’s knees. You get the picture. Yet another pun, sorry. To summarize, when you set your camera to “manual”, you use it set the background (ambient) exposure to your taste. The flash will (usually) handle the foreground subject exposure. Check out a real pro like Neil van Niekerk here to appreciate what flash photography can do for you. I’m not worthy. Samples of Using Manual Exposure and Flash FP Mode 1/640, f/8.0, manual exposure, Auto-FP mode, Nikon SB-600, D7000, Nikkor 60mm f/2.8 AF-D. 1/1000 f/6.3, manual exposure, Auto-FP mode, Nikon SB-600, D7100, Sigma 150-600 C at 600mm. The subject would have been a near-silhouette without flash here. #howto
- Nikkor 85mm f/1.4 AF-S Review
The bulk of this review will concentrate on the lens resolution. The Nikkor 85mm f/1.4 AF-S is considered by many to be the gold standard for Nikon lenses. It not only has outstanding resolution, but it also produces among the best out-of-focus characteristics (bokeh) of any existing lens. This combination, in addition to its perspective at 85mm, makes it the ideal portrait lens. One of the few complaints (other than cost) about this lens is that it doesn’t have vibration reduction (image stabilization). As of this writing, none of the major manufacturers have a fast prime 85mm lens with stabilization. It’s probably non-trivial to maintain the premium optical characteristics and add vibration reduction. Due to its nano-coating, this lens is very resistant to flare. Even still, a lens hood is always recommended. Nikon, as just about everybody knows, also makes an 85mm f/1.8. I don’t own this lens, but it is said to have at least comparable resolution to the f/1.4. People who buy the f/1.4 primarily get it for the ability to obtain a very thin depth of focus wide open, with world-class bokeh in the background. Autofocus isn’t perhaps blazingly fast, but it’s pretty good; keep in mind that f/1.4 takes extreme precision and therefore the focus is slightly slower to achieve this precision. My personal major complaint about this lens (and Nikon isn’t alone) is the spherical aberration. What this means is that focus fine-tune wide open doesn’t work for the lens when the aperture is stopped down. My camera lens combination, for instance, needs +1 at f/1.4, 0 at f/2.0, and -4 when stopped down beyond that. I write this calibration information on the inside of the lens cap, since I’m terrible about remembering these rules. You can always shift to Live View with contrast-detect autofocus to avoid the focus fine-tune problem. What is needed here is a “smart lens”, such as what Sigma offers with its USB dock, that allows in-lens firmware to compensate for this focus shift. Even Sigma only compensates for distance/focal length combinations and not focus shift due to an aperture change. This spherical aberration phenomenon only seems to be an issue on high-speed lenses. If a camera could keep the aperture at the stopped-down position while focusing, then the problem would go away. An aspect of spherical aberration is “spherochromatism”, which this lens shows at wide apertures (I think all really fast lenses exhibit this to some degree). Out-of-focus objects just in front of the plane of focus are magenta and objects just behind are greenish. It’s pretty much academic in real-world use; the effect is really small and is hard to notice unless the subject is white. I briefly had another copy of the Nikkor 85mm f/1.4 AF-S. Note this is in the past tense. Its resolution measurements were generally about 11% worse (some were 26% worse). Not all lenses are made the same. Consult here if you really want to learn about lens-to-lens variation. I read a review of this same model lens here. It sounds like they might have gotten my old lens. If you want to go through the pain of evaluating your own stuff, then you need to get the MTF Mapper program and print out the resolution target files at that site. The software (at this writing) is free, and the author Frans van den Bergh is to be commended. The download site is here . I discuss using his program in another article. Since Frans tends to write for an audience at the mensa level, my article is a ‘Cliffs Notes’ version. You really should give his stuff a read, however. MTF50 Measurements I measure lens resolution at MTF50. Most published manufacturer MTF charts are at MTF10 (contrast) and MTF30 (resolution). Except for maybe Zeiss and Leica, those MTF charts are “theoretical”, meaning they’re blowing smoke you know where. The "MTF" refers to Modulation Transfer Function, which refers to how light/dark transitions happen. "MTF50" refers to the highest line frequency (line pairs per millimeter) you can have before 50% of the contrast is lost. Values above about 30 lp/mm are considered pretty good, and anything above 50 lp/mm is outstanding. I made the tests with a Nikon D7000 (APS-C sensor). If you have a quality lens like this one, then you'll get up to 26% higher resolution by switching to the 24MP sensor D7100 (I tested it). You lucky dogs with your full frame sensors will get slightly different results on the edges. What the resolution chart looks like The picture above shows what gets photographed (unsharpened, RAW) and evaluated. The program author, Frans, has a couple of chart designs, but the main idea is to align the little squares to get their edges in sagittal (spoke) or meridional (tangent) directions. The squares need a little ‘slant’ to them (5 degrees is optimal) to get measured optimally, similar to what Imatest does. Measurement algorithm problems arise if the little square orientations approach vertical or 26.565 degrees. If you try testing yourself, don’t get too sloppy about orienting the chart, and bear in mind that the squares must always be bigger than 25 pixels on an edge. The chart squares emanating from the center along 45 degrees (“X”) have MTF readings that can be 2 or 3 percent higher than they deserve. This is the tradeoff between the desire to get sagittal/meridional measurements and approaching the critical ‘bad’ slant angles. The Imatest guys have punted on this and don’t align their target squares in sagittal/meridional directions; they have 5-degree slants on all of the squares. You’ll see an “X” pattern on some of the 2D resolution plots below, due to this effect. MTF50 85mm f/1.4 wide open This is really good performance for being wide open, in my opinion. It’s just about even resolution across the APS-C sensor, too. I get to avoid any nasty dips that might lurk on those full-frame camera edges. The center of the chart at f/1.4 The MTF Mapper program provides annotations on every measured edge for every little complete square it locates in the photograph. The annotations are in units of “cycles per pixel”. These units are converted into “MTF50 line pairs per millimeter” in the plots, if the program options are configured to request that format. Nikon Official 85mm AF-S MTF ‘theoretical’ chart from their website f/1.4 MTF50 lp/mm over the whole frame This 2D view makes it easy to see how the sagittal direction brings down the averages as you get away from the lens center. The MTF Mapper program also has a 3D view option to turn those reds and greens into mountain peaks. 85mm f/1.4 worst corner for APS-C sensor The worst this lens could come up with is the top-left corner at f/1.4 reading of 28.3 lp/mm in the sagittal direction (0.13 cycles/pixel). The worst is something like 0.15 c/p or 31 lp/mm in the meridional direction. 85mm f/2.0 MTF50 85mm f/2.0 MTF50 85mm f/2.8 MTF50 85mm f/2.8 MTF50 Again, please ignore the little chart bubble defect at the top of the plot. 85mm f/4.0 MTF50 85mm f/4.0 MTF50 85mm f/5.6 MTF50 You’re getting into a rarefied atmosphere here. Due to the resolution chart individual square edge orientations along meridional/sagittal directions, it’s probably fair to knock off about 2 or 3% from the values shown for the squares that align along the main diagonals of the test chart. Even still, these readings are outrageously good. This is peak resolution performance for this lens. 85mm f/5.6 MTF50 85mm f/8.0 MTF50 Diffraction is starting to set in, so the resolution is starting to drop a bit. 85mm f/8.0 MTF50 Sample Images Bear, Sequoia at dusk. 85mm 1/500 f/2.2 ISO 640 at 30 feet. Could have used anti-shake here for my knees. Glad the termites were more appealing than me. Forest 85mm f/1.4 1/200 ISO 200 The background just melts away. This is why you buy this lens. #review
- Nikkor 35mm f/1.8 AF-S G DX Review
This article will show the lens MTF50 resolution performance and discuss how well the lens autofocuses. Repetition of the Nikon specifications of the lens will be mostly avoided. This is one of the most popular Nikkor DX “prime” lenses ever produced. It is also one of the most inexpensive lenses; I avoid labelling it “cheap”, since that has a connotation of “low quality”. Nearly everybody will tell you to “just get one”, and with good reason. It’s reasonably fast, focuses well, and provides the natural perspective that equates to the FX “50mm” standard lens. What you don’t get: vibration reduction and great corner resolution. My usual disclaimer: this is looking at a single copy of the lens. Yours will be different, but hopefully ‘similar’. The only place I know of that tests lots of copies of lenses is here . These tests were done using a Nikon D7100 (24 MP) with unsharpened 14-bit compressed RAW format. Here is a link to get pretty good information on this lens. My main complaint with them (and most of the other web sites) is that they simplify resolution measurement down to a single number for an f/stop. It’s not that simple; resolution is a 2-dimensional thing (not to mention directions within those 2 dimensions). The focus ring on this lens is a properly wide one, nearest the filter. Just like their ‘pro’ lenses, you can use it anytime you want to override autofocus. This ring is much better than most of Nikon’s kit lenses that have that skinny plastic thing at the end of the lens. The lens also has a proper metal lens mount and gasket (rubber seal). That’s it as far as dust/weather resistance is concerned. Annoyingly, there is no distance scale. Not a huge problem, but still it should have one. Also note: don’t use this lens for infrared; it produces a nasty hot spot in the middle of the field of view in infrared; Nikon’s (even less expensive) 50mm f/1.8 AF-D lens in comparison is wonderful when shooting infrared, and it also is an FX lens. As an aside, Nikon’s 18-55 various kit lenses are all very good at infrared. Nikkor 35mm f/1.8 DX AF-S with included hood Autofocus Fast, repeatable, silent. Enough said. All of my lenses need some focus fine-tune calibration; so does this lens. Vibration Reduction (VR) Nope. Helps keep this lens inexpensive. Even Nikon’s 85mm f/1.4 AF-S doesn’t have VR. Just saying. Resolution Testing This is why you should read this article. I won’t mention “good”, “fair”, “excellent” or “blur units” to interpret resolution. I promise. My goal is to enable you to evaluate resolution between lenses in a standard, scientific way. I also give you the information (see my MTF Cliff’s Notes article) to be able to repeat these tests for yourself. Resolution measurements are in MTF50 lp/mm. This measurement represents how many image line pairs can fit inside a millimeter before the white-to-black chart transitions degrade to 50%; e.g. “turn to mush”. For me, anything beyond about 30 lp/mm is fine, and beyond 50 is outstanding. Higher-resolution sensors yield higher measurements, much like you’d expect. Before I forget, you will notice a couple of tiny weird blobs in some of the resolution plots that follow (along the top edge). Please ignore these, since they are definitely not a lens imperfection. The measurement software is extremely sensitive, and an imperceptible chart surface indentation shows up very clearly in the measurements. I guess I’ve been doing too many tests and will soon have to retire this chart. I use a (free!) program called MTF Mapper from here to measure lens resolution. The download site also has files for printing out the resolution targets (mine are A0 size on heavy glossy paper (‘satin’ finish seems to work just as well), dry-mounted onto a board). This program is covered in more detail in another article, but suffice it to say that this is really great stuff; it’s comparable to ‘Imatest’ in the quality of the MTF measurements, and it uses the “slanted edge” technology similar to ‘Imatest’, also. The author of MTF Mapper, Frans van den Bergh, really knows his stuff. Visit his site and give him the praise he deserves. The chart design used for resolution tests orients all of the little black squares to be ‘slanted’ but they’re generally aligned in meridional and sagittal (think spokes on a wheel) directions to correlate better with the usual MTF plots you’re familiar with. There’s often a dramatic difference in sharpness between these two directions, and the chart photographs show it clearly. The meridional/sagittal differences are what “astigmatism” is all about. This lens is decent in the sagittal direction when you get away from the lens optical center, and corners are “okay”. Meridional direction is a less rosy proposition, but judge for yourself in the ensuing resolution plots. The middle of the lens is impressive, as you’ll see. What the resolution target looks like. Mine is mounted ‘upside down’. At long last, I’m getting around to some actual resolution results. Tests were done with “Live View” AF-S autofocus, contrast detect, IR remote, VR OFF, really big tripod. That’s how I get around any phase-detect problems with focus calibration. The results don’t seem to improve using manual focus and 100% magnification in Live View, so I don’t bother. I use the “best of 10 shots”; not every shot gets the same resolution results. All cameras operate on the “close enough” principle for focus, so many tests are needed to determine the best resolution that the lens can produce. Small resolution chart imperfection on top edge; please ignore. Diffraction is exacting its toll at f/16. Sample Pictures Pumpkins that look amazingly like a tiger Panorama from 5 vertical-format shots stitched using the Hugin program #review
- Rokinon Aspherical IF MC 8mm f/3.5 Fisheye
This is the lens version that has an “auto exposure” chip to communicate to the camera, plus a built-in lens hood. The lens is purely manual focus, but auto-focus on a lens this wide would be a bit superfluous anyway (f/5.6 with the scale at about a meter is sharp to infinity). It uses a very sophisticated optical projection formula called “stereographic”, which is extraordinary in a lens of this price. The lens comes in many flavors, including Canon, Sony, Pentax, and Nikon. For some inexplicable reason, the Samyang company calls this lens Rokinon. Even the internal EXIF data for this lens says “Samyang”. Being a fisheye, this lens is very specialized and is an acquired taste (I just cannot resist puns). If you have something like Photoshop or Adobe Elements, then you can use something called “spherize” to largely straighten the rather extreme curved lines without losing the 180-degree field of view. More on that later. Other straightening methods, such as “warp” are also mentioned later, but those techniques will need trimming of the edges, and you won’t end up capturing 180 degrees. If you stick with landscapes and avoid horizon lines, people might not even guess that the pictures were done with a fisheye. See examples below. No single lens can do it all; use the right tool for the right job. First off, promise me that you won’t go taking any pictures of females with this lens. Paraphrasing Hagrid, “they won’t thank you for that”. On the other hand, your rooms will look so huge they’d make inhabitants of Buckingham Palace jealous. You cannot use filters with this lens, so be ready for a bit of a challenge to clean it; the front element is an extreme spherical shape. This is a DX lens; you’ll get a circular image if you try it on an FX sensor camera. Surprisingly, the lens is metal and glass; for its price, you’d expect to see lots of plastic. The lens hood is plastic, though, but not flimsy in any way. The focus ring is rubberized like you’d expect, and has very smooth operation. The lens also has a proper metal lens mount, but no rubber seal. I wouldn’t go out in heavy rain with this baby, but then again I wouldn’t go out in the rain with hardly any of my equipment. The resolution this lens can produce is quite amazing. Just don’t expect that resolution in the corners with the lens wide open. Something I noticed that isn’t quite so nice is that the aperture isn’t entirely accurate. You can get some variation in exposure as you switch to different (small) apertures. The physical area for a given aperture on this lens is incredibly small, given its focal length and is probably very hard to build the mechanics to achieve it precisely. Just be aware of this characteristic. There is also a fairly large amount of chromatic aberration that can be a challenge to control in post processing. The most difficult is the “axial” type; I use Capture NX2 to minimize it. I’d recommend you try out Live View at high magnification to get a feel for how the distance scale on the lens relates to actual focus. My lens has perfect infinity focus when the lens is at the “infinity” hard stop, but at nearer distances the scale differs a bit with reality. This becomes a near “don’t care” when you stop the lens down. What you don’t get: vibration reduction. Not such a big deal on short focal lengths, however. Yes, you’ll get internal reflections to show up when you point it at the sun; they’re generally a pretty small part of the picture, though. It can be difficult to avoid getting the sun in the shot, given the extreme field of view. I didn’t notice any objectional vignetting, which surprised me. Again, take a look at the sample photos at the bottom to see for yourself. Use your favorite image editor to deal with any lateral chromatic aberrations. This is a good video lens, if you don’t get too close to people or pan around too much. If you do pan around too much, your audience will be barfing in the aisles. Although the lens has a computer chip to communicate to the camera, distance information is not properly transmitted and is therefore incorrect in the EXIF data. Rokinon (Samyang) 8mm with fixed lens hood. Looks like 2001 HAL. Distortion Analysis Distortion of the resolution target. Only 18 inches from sensor plane. Same 8mm photo after software distortion correction “spherize -52”. An interesting feature in Photoshop and Elements is “spherize”. It can counteract the distortion to a large extent, although it makes some dog-legs near the frame edges. It maintains the full 180 degree field of view. Other software with more mainstream ‘barrel distortion’ correction only mildly corrects anything, and cuts off the frame edges to boot. But you should be buying this lens BECAUSE it does distortion to get you to 180 degree coverage! There’s also a “warp” feature in Photoshop to help straighten to just about any magnitude you wish, but then you’ll need to crop the borders of what’s left. Lightroom distortion corrections, however, can turn this into a rectilinear super-wide lens that looks quite good. Resolution Testing My goal is to enable you to assess resolution between different lenses in a standard, scientific way. I also give you the information (see my MTF Cliff’s Notes article) to be able to repeat these tests for yourself. The following resolution tests were done using a Nikon D7100 (24 MP) with unsharpened 14-bit compressed RAW format. Resolution measurements are in MTF50 lp/mm. This measurement represents how many image line pairs can fit inside a millimeter before the white-to-black chart transitions degrade to 50%; e.g. “turn to mush”. For me, anything beyond about 30 lp/mm is fine, and beyond 50 is outstanding. Higher-resolution sensors yield higher measurements, much like you’d expect. This is a really tough lens to measure. It drove the MTF Mapper software crazy. Due to the fisheye nature of this lens, I cannot measure right to the corners of the frame. I show some photographs of what the chart looks like below, so you understand what difficulties the measurement process has. Also, the (large) A0 resolution target I used had to be only 18 inches from the camera sensor to fill the frame. As a result, the resolution numbers are for a pretty close focus distance. I use a (free!) program called MTF Mapper from here to measure lens resolution. The download site also has files for printing out the resolution targets (mine are A0 size on heavy glossy paper (‘satin’ finish seems to work just as well), dry-mounted onto a board). This program is covered in more detail in another article, but suffice it to say that this is really great stuff; it’s comparable to ‘Imatest’ in the quality of the MTF measurements, and it uses the “slanted edge” technology similar to ‘Imatest’, also. The author of MTF Mapper, Frans van den Bergh, really knows his stuff. Visit his site and give him the praise he deserves. The chart design used for resolution tests orients all of the little black squares to be ‘slanted’ but they’re generally aligned in meridional and sagittal (think spokes on a wheel) directions to correlate better with the usual MTF plots you’re familiar with. There’s often a dramatic difference in sharpness between these two directions, and the chart photographs show it clearly. The meridional/sagittal differences are what “astigmatism” is all about. This lens is better in the sagittal direction. The meridional direction is terrible until about f/5.6, and it nearly disappears as if by magic around f/8. Strangely, the bad meridional performance at wider apertures was only on the right-hand side of the image, as if the optics were tilted. If it were simply tilted optics, though, then the sagittal values would also have been bad. What the resolution target looks like. Mine is mounted ‘upside down’. Finally, I’m getting around to some actual resolution results. Tests were done with manual focus, IR remote, and a really big tripod. Resolution Results The following measurements need some explaining. The MTF Mapper program has some problems analyzing the whole resolution chart, due to the image distortion. As a result, some of the plots below have a ‘butter fly’ effect. Also, the distortion means that the chart doesn’t extend to the left/right frame edges. This means that there isn’t any “corner” resolution data. First, here are some close-ups showing the meridional-direction problem I spotted. The problems are mostly seen on the right-hand side of the frame. Strange meridional performance at f/3.5 on one side of squares. Meridional performance on frame edge substantially improved by f/8. In the following plots, another anomaly I noted is that the “sagittal” plot indicates a bad center, which is not correct. The center is actually the highest resolution, as can be seen in the “annotated’ resolution chart photos. Frame center is excellent, but MTF Mapper shows it as “bad” sagittal. MTF Mapper doesn’t like the distortion, and won’t measure sections of the frame. Wide open. Meridional is really bad on right of frame. The “butterfly” effect on the sagittal plot is due to the MTF Mapper not recognizing the distorted squares as valid, measurable chart elements. Meridional is still really bad on right of frame at f/4.0 Vast improvement at f/5.6. Even the corners are good. Excellent everywhere at f/8.0 Peak performance at f/11. Impressive at twice the price! Diffraction is setting in, but still good performance at f/22 8mm f/11 NO distortion adjustments. 3-shot HDR using Zoner Pro. 8mm f/11. Again, no distortion adjustments. 6-pointed sunstar. #review
- Nikkor 50mm f/1.8 AF-D FX Review
This article will concentrate on the Nikkor 50mm f/1.8 AF-D MTF50 resolution performance and discuss how well the lens autofocuses. Repetition of the published Nikon specifications of the lens will be mostly avoided. This is one of the most popular Nikkor FX “prime” lenses ever produced, known as the “nifty fifty” (the 50mm f/1.4 shares this title, but the price of the 1.8 makes it much niftier). It’s also one of the most inexpensive Nikkor lenses. I’ve paid more for filters than I did for this lens. This is another of the Nikkor lenses that falls into the category of “just get one”. It’s reasonably fast, focuses well, and is one of the tiniest lenses Nikon has made. It has been superseded by the “G” version, which loses the aperture ring. When used on DX cameras, this is a particularly good focal length for portraits (75mm equivalent). What you don’t get: vibration reduction and great corner resolution when the aperture is wide open. My usual disclaimer: this is looking at a single copy of the lens. Yours will be different, but hopefully ‘similar’. The only place I know of that tests lots of copies of lenses is here. I was lent another copy of this lens (not being reviewed here) and it was NOT good. You need to verify your own copy; I don’t believe that Nikon tests each lens, or else the other copy I was lent wouldn’t ever have made it out of the factory. These tests were done using a Nikon D7100 (24 MP) with unsharpened 14-bit compressed RAW format. Given this fact, I’m not reporting on the edge performance of an FX sensor. Here is a link to get pretty good information on this lens. My main complaint with them (and most of the other web sites) is that they simplify resolution measurement down to a single number for an f/stop. It’s not that simple; resolution is a 2-dimensional thing (not to mention sagittal/meridional directions within those 2 dimensions). The focus ring on this lens is a wide-enough one, nearest the filter. Being a “D” lens, you can’t just use it anytime you want to override autofocus; you need to set your camera into manual focus mode first. Note: keep your hands off the lens during auto-focus; the focus ring will spin around! I’m guilty of virtually never overriding auto-focus on a short lens like this, so manual focus considerations are a “don’t care” for me on this lens unless I’m shooting infrared. The lens also has a proper metal lens mount, but no gasket (rubber seal). There’s no dust/weather resistance. There is a distance scale. Comes in very handy for infrared when I can’t see the subject through the viewfinder. Also note: DO use this lens for infrared! I use it with the Hoya R72 52mm IR filter. There is no “hot spot” in infrared that often happens with lenses, so it works fine for that purpose (in manual focus mode, of course). Nikkor 50mm f/1.8 AF-D FX with 52mm filter. Tiny lens! Autofocus Only works on cameras with the built-in “screw drive” focus motor. If your camera doesn’t have the screw drive, then you will need the more expensive “G” version of the 50mm. All of my lenses need some focus fine-tune calibration; so does this lens. The focus speed is largely controlled by which camera is attached. I haven’t seen repeatability issues on either my D7000 or D7100, and the focus speed has been more than enough. Vibration Reduction (VR) Nope. Helps keep this lens inexpensive. Even Nikon’s 85mm f/1.4 AF-S doesn’t have VR. Just saying. I wish all my lenses had VR, but such is life. MTF50 Resolution Testing This is why you should read this article. I will provide the information to enable you to evaluate resolution between lenses in a standard, scientific way yourself, if you wish to double-check me. Also, since your lens results will be different than mine, the following results are just a guideline. See my MTF Cliff’s Notes article to be able to repeat these tests for yourself. Resolution measurements are in MTF50 lp/mm. This measurement represents how many image line pairs can fit inside a millimeter before the white-to-black chart transitions degrade to 50%; e.g. “turn to mush”. For me, anything beyond about 30 lp/mm is fine, and beyond 50 is outstanding. Higher-resolution sensors yield higher measurements, much like you’d expect. Before I forget, you will notice a couple of weird blobs in some of the resolution plots that follow. Please ignore these, since they are definitely not a lens imperfection. The measurement software is extremely sensitive, and an imperceptible chart surface indentation shows up very clearly in the measurements. The real resolution reference is the annotated photograph of the resolution chart, which shows each little square’s edge in “cycles per pixel” units. I use a (free!) program called MTF Mapper from here to measure lens resolution. The download site also has files for printing out the resolution targets (mine are A0 size on heavy glossy paper (‘satin’ finish seems to work just as well), dry-mounted onto a board). This program is covered in more detail in another article, but suffice it to say that this is really great stuff; it’s comparable to ‘Imatest’ in the quality of the MTF measurements, and it uses the “slanted edge” technology similar to ‘Imatest’, also. The author of MTF Mapper, Frans van den Bergh, really knows his stuff. Visit his site and give him the praise he deserves. The chart design used for resolution tests orients all of the little black squares to be ‘slanted’ but they’re generally aligned in meridional and sagittal (think spokes on a wheel) directions to correlate better with the usual MTF plots you’re familiar with. There’s often a dramatic difference in sharpness between these two directions, and the chart photographs show it clearly. The meridional/sagittal differences are what “astigmatism” is all about. This lens is decent in the sagittal direction when you get away from the lens optical center, and corners are “okay”. Meridional direction isn’t as good, but judge for yourself in the ensuing resolution plots. The middle of the lens is impressive, as you’ll see. What the resolution target looks like. My target is mounted ‘upside down’. At long last, I’m getting around to some actual resolution results. Tests were done with “Live View” AF-S autofocus, contrast detect, IR remote (cell phone, actually), and a really big tripod. That’s how I get around any phase-detect problems with focus calibration. The results don’t seem to improve using manual focus and 100% magnification in Live View, so I don’t bother. I use the “best of 10 shots”; not every shot gets the same resolution results. All cameras operate on the “close enough” principle for focus, so many tests are needed to determine the best resolution that the lens can produce. Frans van den Bergh has an article on how he tested the Nikon D7000 phase-detect focus accuracy by doing a series of tests starting at minimum focus and then a series of tests starting with the lens focused at infinity. He found a definite correlation showing how the camera stopped focusing once it decided that focus was “good enough”, so the infinity-focus-start series would focus a little behind the target, and the start-at-minimum-focus-distance series would end up with focus a little in front of the target. Acceptable center wide open, but corners are a bit off (f/2.0 is similar). Already good edge-to-edge at f/2.8 Stellar center performance by f/4 Peak performance at f/8 Diffraction is exacting its toll at f/16, but still quite good Sample Pictures Fairy Duster 1/80, f/16 50mm up close. 50mm 1/640, f/8 No color fringing, sharp everywhere #review
- Does Focus Calibration Make a Difference?
Most consumer cameras don’t offer focus calibration (auto-focus fine-tune). Many users of enthusiast/professional cameras ignore focus calibration as “a waste of time”. After all, the factory makes nearly every lens and camera fully calibrated, right? Fully not. Top ten things that can use tuning: Cars Musical instruments Husbands/boyfriends Skis Lasers Voices Radio stations Software algorithms Computers Cameras/Lenses Notice that cameras and lenses just made the list. I have never shot with a camera/lens combination that needed a focus calibration of “zero”. Maybe they exist somewhere. Even the 85mm f/1.4 AF-S Nikkors (I’ve tested two of them) need focus calibration at some of their wider f-stops. What kind of price do you pay by not calibrating? Can you even tell the difference? This article shows you what kind of price you pay. My lenses use focus calibration values that range from as little as “+1” to as much as “-20”. The full range of calibration values among all of my lenses varies from “-20” to “+15”. Since the Nikon range is +/- 20, I’m right on the hairy edge. So what happens if you don’t bother to calibrate? You pay a big price in resolution, that’s what. If you only own really slow lenses or only shoot with the lens stopped down quite a bit, then it might be a truly “don’t care” situation. The higher-resolution camera sensors are even more picky about focus calibration. I did a set of tests with my Nikkor 35mm f/1.8 AF-S (DX) on a D7100. It falls into the category of “average” focus calibration, needing a value of “+7”. Not too much fine-tuning compared to my 60mm Micro-Nikkor that needs “-20”, but still nothing to sneeze at. My D7000 needs a fine-tune adjustment of “-5” with the same 35mm lens on it. The following are my test results, conducted with the MTF Mapper program and using an A0 size resolution chart. I turned on phase-detect auto-focus and then switched auto-focus fine-tuning OFF for half of the tests. I tested shooting wide-open, and then I tried stopping the lens down a bit more than 2 stops and re-tested. I forced the lens to minimum focus distance, then used the “AF-ON” button assignment to re-focus between every shot. Take a look at my MTF Mapper Cliff's Notes article on how to perform focus calibration using a proper focus chart and software that can provide definitive answers about if you're in focus or not. First Test: Focus Fine-Tune is OFF f/1.8 Lens Center MTF50 lp/mm Measurements 32 34 32 36 34 f/4.0 Lens Center MTF50 lp/mm Measurements 65 70 70 70 70 Second Test: Focus Fine-Tune is ON (+7) f/1.8 Lens Center MTF50 lp/mm Measurements 50 50 50 50 50 f/4.0 Lens Center MTF50 lp/mm Measurements 70 70 70 70 70 The average f/1.8 MTF50 lens center resolution with no focus fine-tune was 33.6 lp/mm. The average f/1.8 MTF50 lens center resolution with focus fine-tune ON was 50 lp/mm. The average f/4.0 MTF50 lens center resolution with no focus fine-tune was 69 lp/mm. The average f/4.0 MTF50 lens center resolution with focus fine-tune ON was 70 lp/mm. At maximum aperture, the resolution change using fine-tune calibration was HUGE (it went from 33.6 to 50). With the lens stopped down, the resolution change was minimal. So there you have it. If you camera doesn’t have focus fine-tune, then get one if you can afford it. Or else buy Sigma lenses that support their USB calibration dock for in-lens calibration. If you only shoot lenses stopped down, then you can probably safely ignore focus calibration. #howto
- Nikkor 55-200 f/4.0-5.6G ED IF AF-S DX VR Review
This review mostly details the lens MTF50 resolution performance and how well the lens auto-focuses. I don’t need to rehash the Nikon specifications of the lens. Is it just me, or does that lens title seem like all it’s missing is “EIEIO”? You can pick up this lens for dirt cheap, so bear that in mind if you notice any whining in the subsequent paragraphs about things that only exist on pricier lenses. The lens feels like it weighs nothing, and it’s really short for being able to zoom to 200mm. It has a good solid (plastic) bayonet lens shade that will reverse-mount on the lens for really compact storage. It telescopes out as you zoom to 200mm. The lens has a plastic lens mount and no rubber seal. What a shocker ;~) Focus This and the 18-55 kit lens are the only AF-S Nikkors I’m aware of that you can’t override auto-focus with the focus ring. You have to switch the lens to “manual” focus. Yuck. The skinny plastic focus ring is right behind the 52mm filter. Double yuck. If you can stick to auto-focus, though, it’s no problemo. There is no focus scale. Did I say yuck yet? The auto-focus DOESN’T have any chatter. Yay! Beats that evil 70-300 zoom. Speaking of auto-focus, this lens is unfortunately the poorest example I’ve seen from Nikon. It’s slow, and even refused to operate in “cloudy bright” conditions when I tried Live View at f/8.0 on the D7100. The 18-55 kit lens focuses much better. Stick to phase-detect focus. At least it didn’t have any focus chatter. Or did I already mention that? Nikkor 55-200mm zoomed out to 200mm with HB-37 hood Zooming out and using the hood makes it look like a much larger lens. When zoomed to 55mm and having the hood reverse-mounted, it stores away in a really small space. Vibration Reduction (VR) This version of the lens has VR; the original version didn’t. I was able (sticking to decaf) to get about half of my shots sharp at 1/100s with NO VR while zoomed to 200mm. Using VR, I could go to roughly 1/50s. I even got one sharp shot (out of 5) at 1/13s with VR ON. If the rule of thumb is 1/(35mm focal length equivalent) limit, or 1/300s then you could say the VR is good for about 2.5 stops. Everybody is different in how they support the camera while hand-holding it, so your mileage will vary here. I determine “sharp” versus “un-sharp” by photographing a resolution chart at slow shutter speeds and measure where the resolution (MTF50 lp/mm) drops by about 10% from maximum. I don’t know if there is some industry standard on VR effectiveness, but what counts for me is when pictures just start to show some blur, and I like to do it by the numbers. I haven’t figured out how to calibrate my level of nervousness with hand-holding, so this VR business is literally “hand waving”. Oh, also, I test at the longest focal length (200mm). Resolution Testing This review is looking at a single copy of the lens. Yours will be different, but hopefully ‘similar’. These tests were done using a Nikon D7100 (24 MP) with unsharpened 14-bit compressed RAW format. Resolution is a 2-dimensional thing. The tests that follow show you how resolution varies throughout the frame. If you ignore the corners, then resolution is really quite good. About time I said something positive about this lens, isn’t it? Also, the sagittal direction is really, really good. The meridional direction, on the other hand, is really quite terrible and is the culprit in dragging down the MTF50 numbers. I have a few shots below that demonstrate what I’m talking about. You’d swear there was severe motion blur in the pictures, but it’s just the meridional direction optical aberrations. I use a (free!) program called MTF Mapper from here to measure lens resolution. The download site also has files for printing out the resolution targets (mine are A0 size on heavy glossy paper (‘satin’ finish seems to work just as well), dry-mounted onto a board). This program is covered in more detail in my MTF Mapper Cliff’s Notes article. The software is comparable to ‘Imatest’ in the quality of the MTF measurements, and it uses the “slanted edge” technology similar to ‘Imatest’, also. I can’t thank the author of MTF Mapper, Frans van den Bergh, enough. Visit his site and give him the praise he deserves. The chart design used for resolution tests orients all of the little black squares to be ‘slanted’ but they’re generally aligned in meridional and sagittal (think spokes on a wheel) directions to correlate better with the usual MTF plots you’re familiar with. There’s often a dramatic difference in sharpness between these two directions, and the chart photographs show it clearly. If you spot some small islands of resolution peaks/dips in the following charts, you can safely ignore them. Visually imperceptible variations in the surface of the resolution chart can show up rather dramatically in the plots, because the analysis software is exquisitely sensitive. What the resolution target looks like. Mine is mounted ‘upside down’. At long last, I’m getting around to some actual resolution results. Tests were done with “Live View” AF-S auto-focus (where possible), contrast detect, IR remote, VR OFF, and a really big tripod. For f/8 and beyond, I was forced to use manual focus using Live View at 100%, since it refused to focus automatically. I use the “best of 10 shots”; not every shot gets the same resolution results. All cameras operate on the “close enough” principle for focus, so many tests are needed to determine the best resolution that the lens can produce. 55mm f/4.0 APS-C Corner. Note Sagittal is MUCH better than Meridional The corner at 55mm f/4.0 shows how much worse the meridional direction is than the sagittal direction. Also note the vignetting (I don’t care much about vignetting, since it’s easy to fix in post processing). There is very slight chromatic aberration (this is the unmanipulated RAW view), which is also trivial to fix in post. 55mm f/4.0 center looks good 200mm f/5.6 corner. Good unless you count the meridional direction! Lens center 200mm f/5.6. Unusually poor dead center, but much better resolution just a little off of center. See 2D plots below for overall resolution view. Conclusions While not in the ‘pro’ category, this lens is still capable of producing some fine photographs, even wide open. If you can tolerate f/11, it’s capable of truly good shots. It’s all about knowing a lens strengths and weaknesses. For 200mm, it’s exceptionally portable and light. You can’t beat the price. I’d avoid low light levels; without a distance scale, even manual focus can be a challenge. The picture below gives you a hint of what the lens is capable of doing with a bit of practice. Sample Picture Rabbit at a dead run, 1/500s f/5.6 55-200mm at 200mm, ISO 400, VR ON, 37 feet. Very few shots require sharp corners. This shot has always been a favorite of mine, done with one of the cheapest and least glamorous lenses that Nikon makes. It looks quite sharp, even in a print I have that’s 36 inches wide. It was taken by my daughter, who got her amazingly fast reflexes by competing in fencing (foils) competitions for years. Try shooting wild rabbits on the run and you’ll appreciate the shot even more. #review
- Nikkor 18-55 f/3.5-5.6G AF-S VR DX Review
This review will emphasize the lens MTF50 resolution performance and how well the lens auto-focuses. I was feeling guilty about not writing a review of what is probably the most populous Nikon lens of the modern age. So here it is. The lens is so light that it feels like it’s filled with helium. It’s supplied with a lens cap and an end cap and … nothing. The lens has a plastic lens mount and no rubber seal. Exactly as you’d expect. So what DOES this lens have? It has resolution. And it’s my go-to lens for infrared. Large, quality infrared filters are devilishly expensive, so the 52mm filter threads on this lens are a welcome sight. Focus This lens won’t let you override auto-focus with the focus ring, which I used to think was a ‘given’ with AF-S. Wrong. You have to switch the lens to “manual” focus. Major complaint here. The auto-focus fine-tune on this lens is ZERO at 55mm, but it’s -4 at 18mm (these numbers are for my D7100, but different on the D7000). Since this isn’t a Sigma lens with the ability to fine-tune at various focal lengths and distances, I’m kind of stuck unless I stop the lens down to f/8 or so. I decided to split the difference and set the fine-tune on -2. The skinny plastic focus ring is right behind the 52mm filter. There is no focus scale. Given this meager working set, it can be tricky to manage getting the lens focused, keep the focus ring steady, and screw on an infrared filter. The auto-focus DOESN’T have any chatter using my usual AF-C and rear focus button. Yay! Speaking of auto-focus, this lens is more in the ‘turtle’ category than the ‘rabbit’ category. At least it eventually gets there. I exaggerate, of course. Nikkor 18-55mm on the D7000. Using my classic (1974!) L39 filter. Get a load of that world-record-skinny focus ring knurling behind the filter! Speaking of the filter, it’s not one you’d want to point toward the sun. It’s uncoated, but it has been my friend most of my life and I could never get rid of it. Vibration Reduction (VR) This version of the lens has VR; the original version didn’t. Newer versions now have “VRII”. I was able to get about 2.5 stops of anti-shake, but my results vary a lot. Everybody is different in how they support the camera while hand-holding it, so any quote about VR effectiveness isn’t really a rule; it’s more of a guideline. Yes, that line was stolen from Jack Sparrow. Resolution Testing This review is looking at a single copy of the lens. Yours will be different, but hopefully ‘similar’. Some day I might get around to testing more of these things, since I have a few more laying around. These tests were done using a Nikon D7100 (24 MP) with unsharpened 14-bit compressed RAW format. Resolution is a 2-dimensional thing. The tests that follow show you how resolution varies throughout the frame. The resolution charts are split into “sagittal” direction (like wheel spokes) and “meridional” directions. These directions match the MTF references published by Nikon. What’s different, though, is the following values were MEASURED versus Nikon’s “theoretical” values. Also, the sagittal direction is quite good. The meridional direction isn’t nearly as good and is the culprit in dragging down the MTF50 numbers. I use a (free!) program called MTF Mapper from here to measure lens resolution. The download site also includes files for printing out the resolution targets (mine are A0 size on heavy glossy paper, dry-mounted onto a board). This program is covered in more detail in my MTF Mapper Cliff’s Notes article. The software is comparable to ‘Imatest’ in the quality of the MTF measurements, and it uses the “slanted edge” technology similar to ‘Imatest’, also. The author of MTF Mapper, Frans van den Bergh, provides this excellent software for FREE. Visit his site and give him the praise he so richly deserves. The chart design used for resolution tests orients all of the little black squares to be ‘slanted’ but they’re generally aligned in meridional and sagittal (think spokes on a wheel) directions to correlate better with the usual MTF plots you’re familiar with. There’s often a dramatic difference in sharpness between these two directions, except in the most expensive of optics. If you spot some small islands of resolution peaks/dips in the following charts, you can safely ignore them. Visually imperceptible variations in the surface of the resolution chart can show up rather dramatically in the plots, because the analysis software is exquisitely sensitive. What the resolution target looks like. Mine is mounted ‘upside down’. At long last, I’m getting around to some actual resolution results. Tests were done with “Live View” AF-S auto-focus, contrast detect, IR remote (via a cell phone), VR OFF, and a really big tripod. I use the “best of 10 shots”; not every shot gets the same resolution results. All cameras operate on the “close enough” principle for focus, so many tests are needed to determine the best resolution that the lens can produce. Corner at 18mm f/3.5 Center at 18mm f/3.5 Conclusions While definitely not a ‘pro’ lens, this lens is still capable of producing some fine photographs, even wide open. You can’t beat the price. Without a distance scale, even manual focus can be a challenge. With my copy, the longer focal lengths are the weakest (typical of almost all zooms, by the way). Corners aren’t stellar, but surprisingly good. The center is really good at all focal lengths; nothing to complain about here. My own style dictates that I use this lens at 18mm maybe 90% of the time. Luckily, it has great optical performance at that length. Sample Pictures 18mm f/10 Hoya R72 (Infrared) with Red/Blue color channel swap Sequoia 18mm HDR using Efex Pro2 HDR. Some chromatic aberrations visible #review
- Nikkor-P C 105mm f/2.5 Review
This is a pre-AI model, and was tested on the D5000, which Nikon specifically states is incompatible with this camera. Hmm. This lens was the reason many people bought Nikon. In its day, it was the portrait lens to get. I remember Linda McCartney using this lens to take pictures of Paul in a televised concert. It’s my understanding that she could afford to use whatever gear she wanted, seeing as her husband was already a near-billionaire at the time. This lens version had anti-reflection coating (the "C" in the lens designation). This is another lens that was used in the making of the original Star Wars movies. The MTF50 measurements presented below, being produced from a 12MP camera, don’t look as high as more modern high-resolution sensors. This lens won’t fit my other cameras, and isn’t one that can be updated to “AI”, either. Focus Silky smooth, but totally manual. When you could get cameras with split-prism focusing screens, focus was a breeze. With cameras these days, manual focusing is a lot tougher. Such is progress. I had thought the D5000 “rangefinder focus” would be the answer, but it won’t work for these manual lenses. Oh well. Nikkor-P C 105mm f/2.5 with HS-4 hood on D5000. An elegant lens. Resolution Testing These tests were done using a Nikon D5000 (12 MP) with unsharpened RAW format. Resolution is a 2-dimensional thing. The tests that follow show you how resolution varies throughout the frame. Also, the sagittal direction is really, really good. The meridional direction isn’t as good, but is still better than most lenses. I use a (free!) program called MTF Mapper from here to measure lens resolution. The download site also has files for printing out the resolution targets (mine are A0 size on heavy glossy paper (‘satin’ finish seems to work just as well), dry-mounted onto a board). This program is covered in more detail in my MTF Mapper Cliff’s Notes article. The software is comparable to ‘Imatest’ in the quality of the MTF measurements, and it uses the “slanted edge” technology similar to ‘Imatest’, also. I can’t thank the author of MTF Mapper, Frans van den Bergh, enough. Visit his site and give him the praise he deserves. The chart design used for resolution tests orients all of the little black squares to be ‘slanted’ but they’re generally aligned in meridional and sagittal (think spokes on a wheel) directions to correlate better with the usual MTF plots you’re familiar with. There’s often a dramatic difference in sharpness between these two directions, and the chart photographs show it clearly. If you spot some small islands of resolution peaks/dips in the following charts, you can safely ignore them. Visually imperceptible variations in the surface of the resolution chart can show up rather dramatically in the plots, because the analysis software is exquisitely sensitive. What the resolution target looks like. Mine is mounted ‘upside down’. Finally, I’m getting around to some actual resolution results. Tests were done with “Live View” manual focus at maximum magnification and IR remote. I use the “best of 10 shots”; not every shot gets the same resolution results. Corner, wide open at f/2.5 target squares cycles/pixel. Sagittal beats meridional. Center, wide open at f/2.5 target squares cycles/pixel. The corners aren’t really good until f/4.0, but the center is terrific at all apertures until a little beyond f/16. You don’t want to use f/16 or beyond if resolution is important to you. Diffraction kills sharpness. I didn’t bother to measure, although this lens lets you set the aperture all the way down to f/32. The resolution of this lens leaves almost nothing to complain about. The corners, which are a “don’t care” nearly all of the time for most people, need f/4.0 or more. Conclusions If you’re a “manual” kind of person who likes to be in charge of what is going on, then this just might be the “it” lens for you. Bear in mind that the lens mount doesn’t permit being mounted on the latest Nikons, and this version cannot be “AI converted”. I have always enjoyed using this lens for portraits, and it gives you enough working room that your subject is invariably more at ease. You can’t exactly quantify it, but this lens just feels right. Sample Picture Crop from a head shot. The eyes tell the story of this lens. #review
- Why Is My Full-Frame Worse Than My APS-C MTF50 Measurement?
It might seem shocking at first to see that your full-frame camera can have poorer lens resolution scores than the cheapo APS-C sensor. Here’s what is probably going on. Your small-frame sensor probably has smaller pixels than that full-frame camera does. Smaller pixels means more pixels per millimeter on the sensor, and hence more lines per millimeter, too. Here’s a specific example. Let’s compare the D7100 to the D610. Both cameras are roughly 24MP, so you’d think that they would score about the same. D7100 4000 X 6000 pixels, and has dimensions of 3.92 microns for each pixel. The D7100 sensor itself is 15.6 mm X 23.6 mm. D610 4016 X 6016 pixels, with 5.95 micron pixels and is 24.0 mm X 35.9mm. Let’s look at some resolution measurements, using the same lens at the same f/stop. Here, I’m using the Sigma 150-600 at 600mm, f/6.3. D7100 with Sigma 150-600 at 600mm f/6.3 tops out at MTF50 of 40 lp/mm D610 with Sigma 150-600 at 600mm f/6.3 tops out at MTF50 of 34 lp/mm Did I get ripped off?? Why is the resolution so much worse with the D610 compared to the D7100? The secret lies in the pixels. There are less pixels per millimeter in the D610, and therefore less MTF50 lp/mm resolution. But there are more millimeters in the D610 sensor! The key measurement of interest here is in line pairs per picture height (lp/ph). The math: lp/ph = lp/mm * mm_of_height The D7100 sensor height is 15.6 mm. The D610 sensor height is 24.0 mm. For the above measurements, the D7100 measures 40 lp/mm * 15.6 mm = 624 lp/ph The D610 measures 34 lp/mm * 24.0 = 816 lp/ph. So, the D610 wins after all. It has a ‘score’ of 816 and the D7100 has a ‘score’ of 624. More total lines of resolution in the photo for the D610. But wait, there's more: D610 pixel area = 35.4 square microns D7100 pixel area = 15.4 square microns This means that the D610 pixels can drink up more than twice the light per pixel, which makes for vastly superior low-light and high-ISO abilities. You can also achieve narrower depth of focus with the full-frame sensor, so you have more options photographically. Feel better now? #howto