Lens Longitudinal Chromatic Aberration in Infrared
- Ed Dozier
- Dec 19, 2025
- 4 min read
There’s very little information about how camera lenses perform when photographing in the infrared. There’s even less information about what lens designers consider in their design and analysis accommodating light outside of the visible spectrum.
I decided to take a lens that is well-corrected in visible light and see what happens in a couple of different wavelength regions of infrared. Most lenses have trouble focusing with infrared light; camera companies used to even put a little mark on their lenses to show you how much to compensate focus for IR.
In this study, I’m going to concentrate on analyzing longitudinal chromatic aberration (LoCA). I had a camera converted to infrared by Kolari Vision, which includes an infrared anti-reflection coating on their sensor cover (very helpful for eliminating hotspots). This modification passes wavelengths above 590nm, which then includes red/orange plus infrared.

LoCA when using visible-spectrum light
As you can see above, the light that we perceive can get focused at different distances along the lens axis when LoCA is present. Infrared (all IR frequencies lumped together) may or may not get similarly split up by the lens.
I frequently put an 850nm infrared filter on my lenses when shooting infrared with my IR camera, so I thought it would be prudent to include an analysis using that portion of the light spectrum, too. This filter only passes long-wavelength IR, so the photographs look like black-and-white.
I use the MTFMapper program to look at LoCA. The author Frans van den Bergh provides a couple of different files that can be printed out for analyzing LoCA. In his program, you configure it to look at focus shift using red or green or blue Bayer sensor information from photographs of a focus chart. The chart is rotated about the vertical axis to be 45 degrees from the camera sensor, with the shorter vertical bars nearer to the camera. The chart rotation is what allows the program to note where the peak focus is.
I printed the focus chart using a laser printer. If I had tried using an inkjet printer, then the printout would have been invisible when shooting infrared. The carbon black toner used in laser printers is opaque to infrared, while the ink in inkjet printers is mostly transparent to infrared.
I chose my Nikkor 24-70 f/2.8 AF-S VR zoom for the testing. This lens has a pretty low level of LoCA, but that ‘low level’ is only advertised for visible light.
A lens with zero LoCA would have the red, green, and blue channels overlap perfectly and therefore all light from a subject focuses at the same distance. I focus the lens on the chart center, but that’s rarely where best focus ends up.

Focus chart detail, red channel, visible light
The shot above shows a piece of a focus chart after analysis. In this case, focus was close to perfect (2.6mm closer to the camera than the chart center) and the center of focus (blue line) is close to the chart center (orange arrows). The green plot shows the highest resolution (best focus) at different distances from the camera, measured in cycles per pixel of contrast. The peak focus shows 0.125 cycles/pixel of contrast here, at 2.6mm from the chart centerline.
The black circles in the plot are called ‘fiducials’, which let the MTFMapper program know where things are in the plot, and how to evaluate and measure what it sees.
Visible light R,G,B focus at 70mm f/2.8
The triplet of pictures above show the chart analysis in red (left), green (center), and blue (right). The red focus +2.6 millimeters from the chart center. The green focus is +15.1mm nearer to the camera than the chart centerline. The blue focus is +9.2mm nearer to the camera, or in between the red and green focus. The whole range of focus with visible light is therefore 12.5mm using this chart. The red, green, and blue measurements are all made from a single chart photograph (no lens focus change), separately analyzing the red, green, and blue sensor pixels.
The chart was photographed with a regular-spectrum camera (Nikon Z9) using the same Nikkor 24-70 f/2.8 lens. The LoCA is fairly low, and probably wouldn’t be noticed in normal photography.
There are two styles of focus charts that are provided with the MTFMapper program. I chose the plot style shown above, because it’s much easier to see the overlaid results against a mostly-white background. The accuracy of the results is no different, if the different charts are printed to the exact same size on the exact same paper. You’ll note that all of the little round fiducials are the same in both styles of charts.
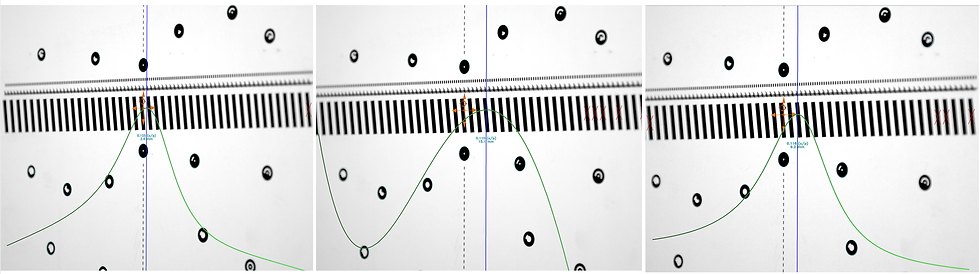
590nm Infrared R,G,B focus at 70mm f/2.8
Switching to 590nm infrared, the results are very, very different. The red focus (left chart) is at +6.8mm, or shifted toward the camera relative to the chart centerline. The green focus (middle) is -6.2mm. The blue focus (right) is -56.6mm (away from the camera), and quite dim. The whole range of focus with 590nm infrared is therefore 63.4mm using this chart (compared to 12.5mm in the visible spectrum).
This makes the lens look horrendous for longitudinal chromatic aberration, and the blue camera sensor pixels are starved for light.
Next, I put the 850nm infrared filter over the lens…

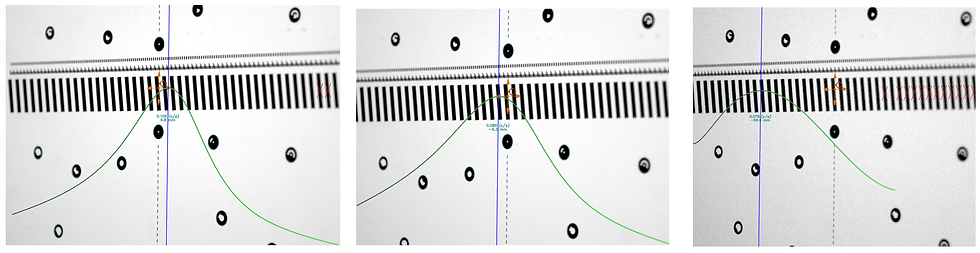
850nm Infrared R,G,B focus at 70mm f/2.8
The red focus (left) is at +11.5mm, with the green focus (center) at +10.5mm, and the blue (right) focus is at +11.6mm.
The whole range of focus with 850nm infrared is therefore only 1.1mm using this chart. That’s an amazingly consistent focus between the three color channels.
Not all infrared is the same! Using just the very long-wavelength 850nm infrared, the lens looks nearly perfect for LoCA. Lens performance can be very misleading, depending upon the light spectrum being tested.
The MTFMapper program has many features for testing your lenses. You’re unlikely to find any information at all about your particular lenses when shooting infrared from the manufacturer. This program enables you to find out those optical characteristics yourself.


En comparant différents sites, j’ai remarqué que beaucoup restent assez limités dans leurs explications, ce qui rend difficile la prise de décision, surtout quand on cherche quelque chose de durable. Les descriptions sont souvent répétitives. En passant par Chaussettes Francaise chez Kindy, j’ai trouvé que le contenu apportait une vision plus claire, sans en faire trop. Cela m’a permis d’avancer dans ma recherche avec une meilleure compréhension des critères importants.